AMP Solar Phase 2 Project
In March 2016, AMP entered into a joint development agreement with DG AMP Solar, a wholly owned subsidiary of NextEra Energy Resources, for the development of solar* electric generation facilities.

AMP Solar Phase II Project
Through its DG AMP Solar, LLC subsidiary, NextEra developed, constructed and now operates the facilities, which are all located behind participating Members’ meters. The two organizations executed a solar power purchase agreement (PPA). American Municipal Power, Inc. (AMP) purchases all output from the solar generation and then sells the output to 22 participating Members using a take-and-pay contract.
The systems each consist of solar photovoltaic generating facilities that use polycrystalline photovoltaic modules and central inverters. The modules are mounted on either a fixed tilt or tracker racking system. Each system is interconnected to the electric distribution system of a host participating community and is located on land within or near the geographic footprint of the host participant.
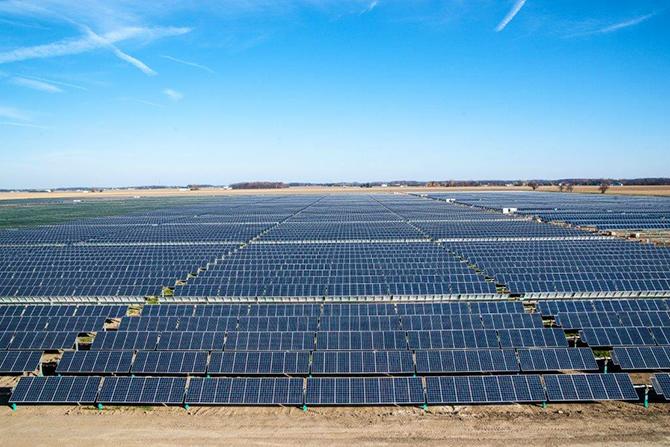
There are 16 systems with a rated capacity of approximately 58.325 megawatts (MW) located in Delaware, Michigan, Ohio and Virginia. The systems have a rated capacity ranging from 0.25 MW to 20 MW. The first of the systems, located in Bowling Green, entered commercial operation in January 2017 (see more on the Bowling Green Solar Facility below). A list of the systems and the performance of each relative to P90 are set forth below in the following tables.
Systems
| Site | Rated Capacity (in MW) | Commercial Operation Date |
|---|---|---|
| Bowling Green | 20.000 | 1/24/2017 |
| Marshallville | 0.700 | 3/3/2017 |
| Prospect | 0.250 | 3/3/2017 |
| Front Royal | 2.500 | 5/8/2017 |
| Orrville #2 | 0.950 | 1/26/2018 |
| Versailles | 1.750 | 1/29/2018 |
| Haskins | 0.700 | 1/29/2018 |
| Coldwater | 1.305 | 2/1/2018 |
| Jackson Center #2 | 1.620 | 2/8/2018 |
| Orrville #3 | 2.250 | 3/3/2018 |
| Smyrna | 1.170 | 7/6/2018 |
| Piqua Staunton | 1.755 | 9/1/2018 |
| Brewster | 1.875 | 1/1/2019 |
| Piqua Manier | 12.625 | 7/17/2019 |
| Wadsworth Seville Rd. | 6.250 | 3/1/2020 |
| Wadsworth Rittman Rd. | 2.625 | 6/1/2020 |
| Total | 58.325 |
Historical Performance of Systems
2024 Calendar Year
| Site | Actual Production (in MWh) | P90 Projection (in MWh) | Variance (%) | Capacity Factor (%) | Availability Factor (%) |
|---|---|---|---|---|---|
| Bowling Green | 38,820 | 37,931 | 2.3 | 22.1 | 99 |
| Marshallville | 1,101 | 1,057 | 4.2 | 17.9 | 100 |
| Prospect | 394 | 407 | (3) | 18.0 | 100 |
| Front Royal | 3,959 | 4,076 | (2.9) | 18.0 | 97 |
| Orrville #2 | 1,311 | 1,322 | (0.8) | 15.7 | 100 |
| Versailles | 2,708 | 2,527 | 7.2 | 17.6 | 100 |
| Haskins | 882 | 1,051 | (16.1) | 14.3 | 99 |
| Coldwater | 2,027 | 1,890 | 7.2 | 17.7 | 100 |
| Jackson Center #2 | 2,816 | 2,643 | 6.5 | 19.8 | 100 |
| Orrville #3 | 3,322 | 3,180 | 4.5 | 16.8 | 100 |
| Smyrna | 1,829 | 1,718 | 6.4 | 17.8 | 100 |
| Piqua Staunton | 2,640 | 2,791 | (5.4) | 17.1 | 100 |
| Brewster | 2,356 | 2,371 | (0.6) | 14.3 | 100 |
| Piqua Manier | 22,013 | 21,373 | 3.0 | 19.80 | 100 |
| Wadsworth Seville Rd. | 10,566 | 10,837 | (2.5) | 19.3 | 94 |
| Wadsworth Rittman Rd. | 3,555 | 3,669 | (3.1) | 15.4 | 98 |
| Total/Average | 100,299 | 98,842 | 1.5 | 19.6 | 99 |
2023 Calendar Year
| Site | Actual Production (in MWh) | P90 Projection (in MWh) | Variance (%) | Capacity Factor (%) | Availability Factor (%) |
|---|---|---|---|---|---|
| Bowling Green | 39,642 | 38,122 | 4 | 22.6 | 100 |
| Marshallville | 1,143 | 1,063 | 7.6 | 18.7 | 100 |
| Prospect | 399 | 409 | (2.4) | 18.2 | 100 |
| Front Royal | 4,259 | 4,096 | 4 | 19.4 | 100 |
| Orrville #2 | 1,303 | 1,329 | (2) | 15.7 | 100 |
| Versailles | 2,683 | 2,539 | 5.7 | 17.5 | 100 |
| Haskins | 648 | 1,057 | (38.7) | 10.5 | 99 |
| Coldwater | 1,994 | 1,900 | 5 | 17.4 | 100 |
| Jackson Center #2 | 2,790 | 2,657 | 5 | 19.7 | 100 |
| Orrville #3 | 3,299 | 3,196 | 3.2 | 16.7 | 100 |
| Smyrna | 1,911 | 1,727 | 10.7 | 18.6 | 100 |
| Piqua Staunton | 2,610 | 2,805 | (6.9) | 17 | 100 |
| Brewster | 2,251 | 2,383 | (5.5) | 13.7 | 100 |
| Piqua Manier | 21,763 | 21,480 | 1.3 | 19.7 | 100 |
| Wadsworth Seville Rd. | 11,257 | 10,891 | 3.4 | 20.5 | 100 |
| Wadsworth Rittman Rd. | 3,610 | 3,687 | (2.1) | 15.7 | 100 |
| Total/Average | 101,564 | 99,338 | 2.2 | 20 | >95 |
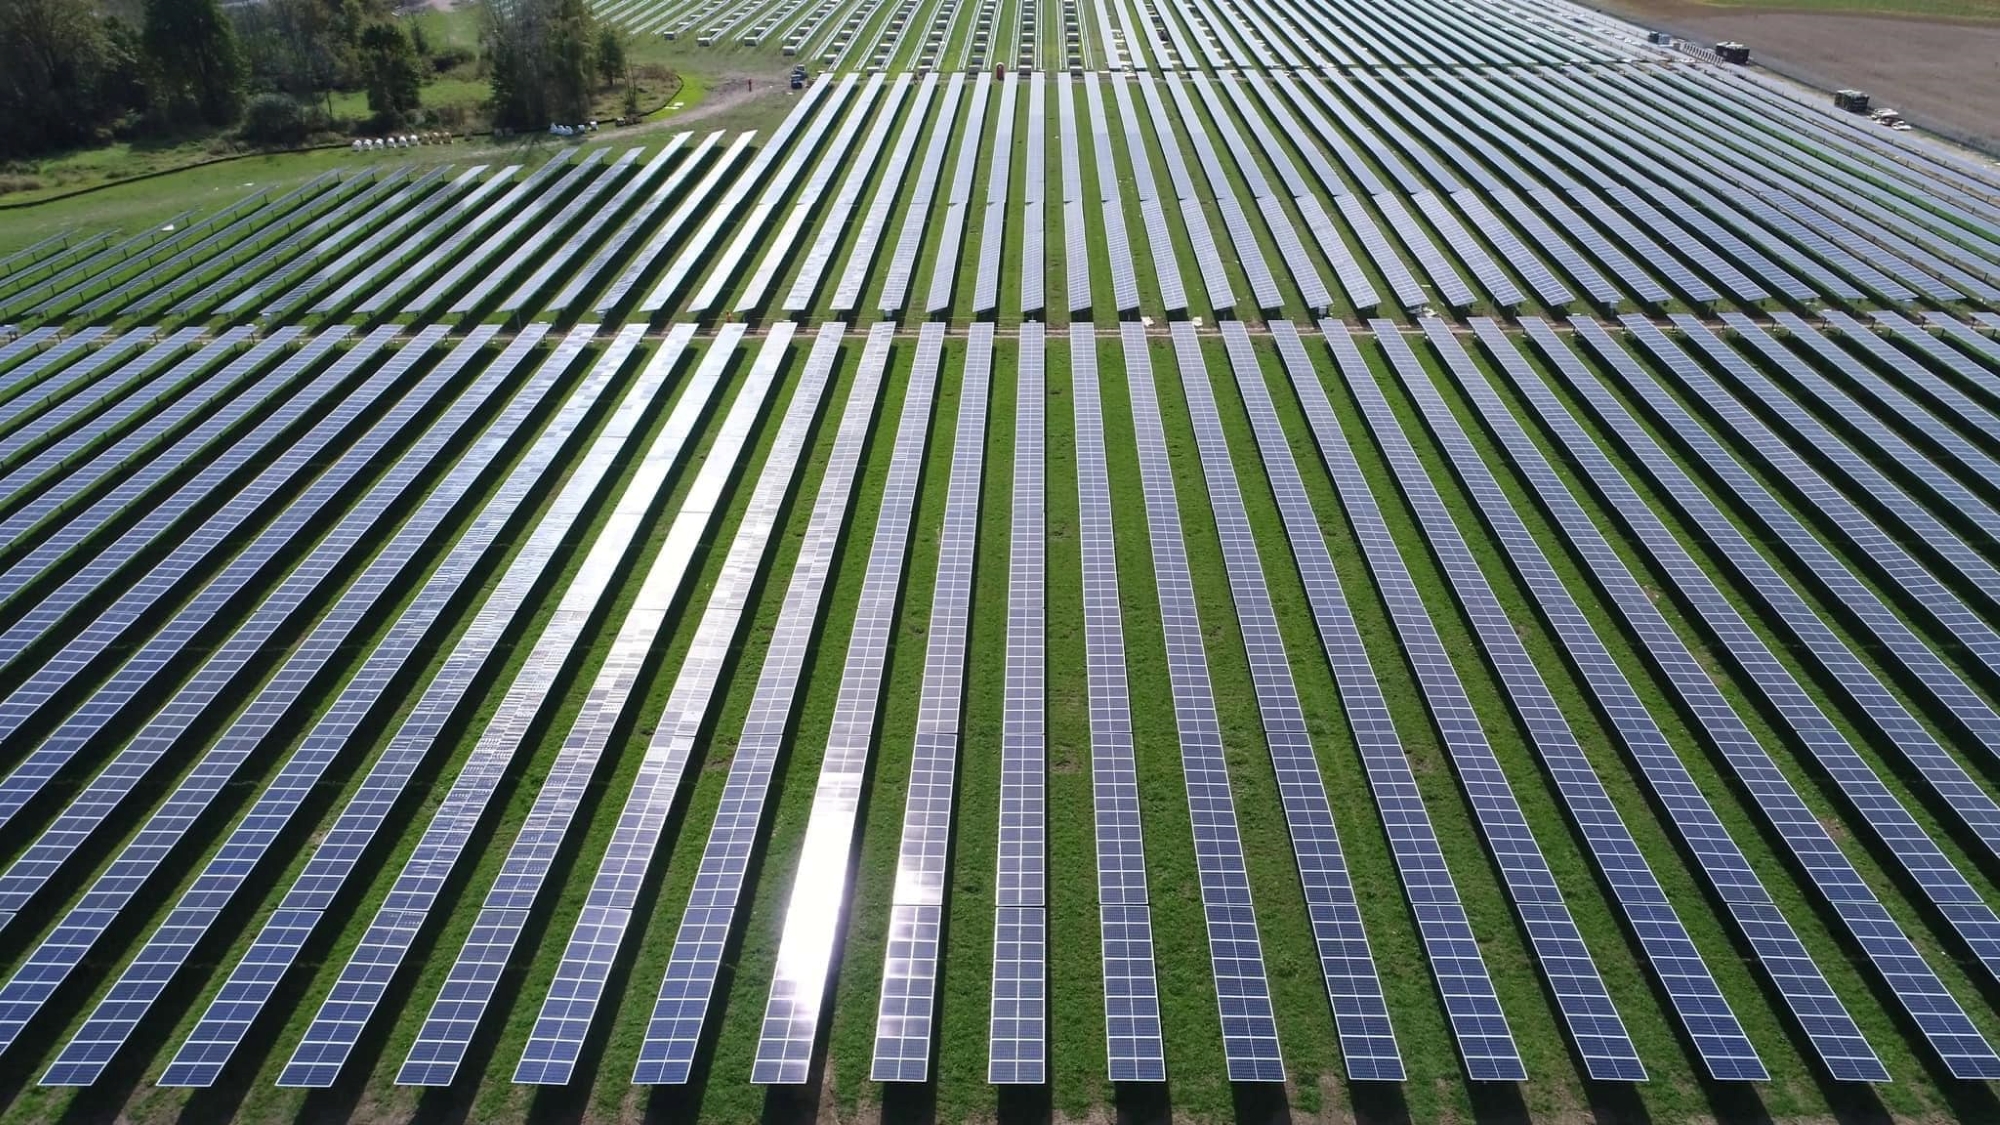
Bowling Green Solar Facility
The Bowling Green Solar Facility, one of the largest solar installations in the state of Ohio, is a 20-MW installation located in Bowling Green and is part of the AMP Solar Phase II Project.
NextEra Energy and their engineering, procurement and construction contractor, Blattner Energy, began construction in July 2016 and achieved mechanical completion in December 2016. The site achieved commercial operation in January 2017.
The Bowling Green Solar Facility consists of 85,680 modules, twenty 1-MW inverters, ten 34.5-kilovolt (kV) transformers and spans 165.09 acres. The site also uses a tracker system that aids in maximizing production. A substation was also built on site that steps the voltage up from 34.5 kV to 69 kV.
Bowling Green Facility Facts
*Note that AMP, on behalf of its Members, sells all or a portion of the renewable energy certificates created by its renewable energy projects, power purchase agreements and joint ventures to help reduce its wholesale power costs.